Contents
About
The VVG 3D Visualisation tool is the result of a collaboration between Federation University Australia and Queensland University of Technology. The system has been designed to take advantage of new web technologies and is currently in beta testing.
The 3D scene is a tool that allows you to see areas from the VVG portal in 3D.
- This includes aquifer layers, WMIS bores and surface elevation.
- There are many options for user customisation which are detailed in this user guide.
Return to contents
Requirements for viewing 3D scene
To ensure the 3D Scene works best for you, please check these minimum/recommended requirements.
- Compatible operating systems:
- Any platform that is able to install the latest compatible browsers (as noted below) should work. Windows XP is unable to install above Internet Explorer 8 and therefore is not compatible.
- Browser requirements:
- Chrome, Firefox, Safari (latest versions), Internet Explorer 10 or above.
- Other browsers may work, however they have not been tested for compatibility.
- If your browser does not meet the minimum requirements a message will come up on your screen with the relevant information.
- Internet connection recommendations:
- Stable internet connection
- Ethernet connection is recommended over wireless
- Internet speeds >2Mbs
- Screen requirements:
- Widescreen monitor size of 20" and above recommended for best viewing.
- Mobile and tablet viewing not recommended at this stage
- WebSocket connection:
- Connection to Port 30001 (to test your computer go to http://websocketstest.com/)
- Note: Government departments and some other organisations have this port blocked. We are working on a solution for the near future.
Return to contents
Accessing 3D Scene
- Access to 3D Scene is via the VVG portal. The option will be greyed out until you are zoomed in to a minimum of 1:108K (as shown in bottom left corner of portal).
- Zoom into the area you would like to see in 3D and click on '3D Scene' which is located in the top right corner of the map under the Google layers (Figure 1).
- You will be redirected to the 3D Scene webpage in a new tab or window.
| 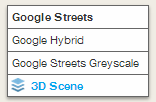
Figure 1
|
Return to contents
Navigation
- Navigation directions are located at the bottom of the 3D Scene page and include:
- ROTATE scene: Left Mouse + Drag
- ZOOM: Right Mouse + Drag (or scroll wheel)
- PAN: Left Mouse + Right Mouse + Drag
- SELECT Bore: Left Mouse + Double Click
- For more viewing options go to Viewing tools.
Return to contents
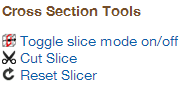
Viewing tools
- These tools (Figure 2) are found in the top right hand corner:
- Toggle Perspective - Click on this to change the perspective (two options).
- Toggle axis - Click on this to remove the box around the 3D Scene and its depth and coordinate markers (Eastings and Northings).
- Reset View - click to go back to the original view that first loaded, including removing any slice you have made.
- Top, bottom, North, South, East and West view - clicking on these shows the face of that view
- Slice front and back view - When you use the slice tool, this give you a section view from the front (where the slice was taken) or the back (the edge).
| 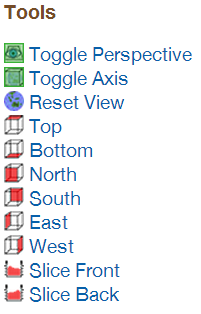
Figure 2
|
Return to contents
Axis
- When the scene loads, there is an axis (Figure 3) in the top right corner that shows:
- Blue cone - upwards direction
- Green cone (N) - North direction
- Red cone (E) - East direction
- This axis can be moved by clicking the mouse over it and dragging to move it to your position.
| 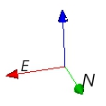
Figure 3 |
Return to contents
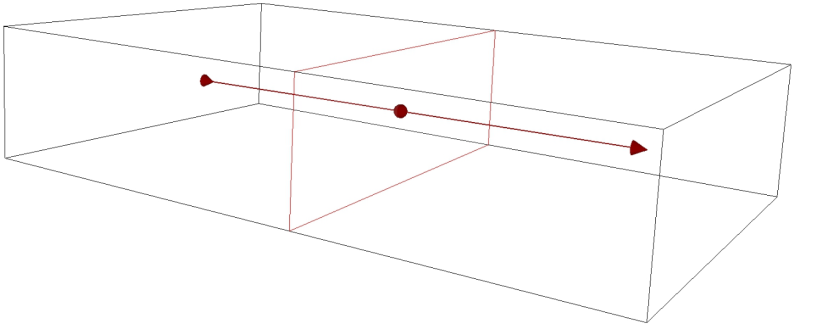
Creating a cross section
Return to contents
Sliding scale tools
Vertical exaggeration
- The vertical exaggeration tool (Figure 7) increases the vertical scale to allow you to see vertical features more clearly in the landscape.
- The tool is featured as a sliding scale on the right side of the 3D Scene page
- The default is set to 15x (vertical scale 15 times greater than the horizontal scale) and by clicking on the scale slider you can vary it between 1x and 100x.
| 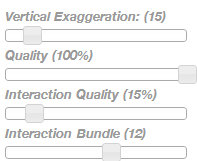
Figure 7 |
Quality
- This is a sliding scale for the size of the pixels displayed in the 3D scene. A higher percentage will give better quality, but will slow down load times. Figure 8 shows 0% versus 100%
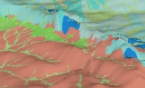
Figure 8
Interaction quality
- This is a sliding scale that shows the quality of the image whilst you are interacting with the scene, for example moving to a different view angle with the mouse button pressed down. The higher the percentage you have this set to the better the quality whilst moving your picture, however this will significantly slow down your ability to navigate smoothly. Once you have released the mouse button, the image quality will load to the percentage you have in 'Quality'.
Return to contents
Bores
Bore sources included in the 3D scene
- The bores shown at this stage include only the WMIS bores.
Information shown when you click on a bore
- Double mouse click a bore at the site marker (pentagonal cone) and the marker will have a light grey cover shown over it, the bore ID will be shown and if depth information is available it will be shown as per Figure 9. The red pipeline will change to a dashed line.
| 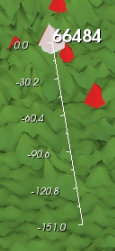
Figure 9 |
Return to contents
Change bore appearance - turn off bores, change size and features
| The bores are shown in the 3D Scene as red pentagonal cones above the surface connected to cylinders below the surface (to denote depth where available). These can be manipulated to have aspects shown or not shown. The bore radius can be changed and information about the bores can be shown. | 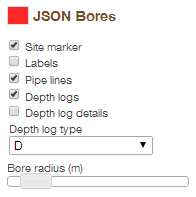
Figure 10 |
- To show the options for changing the bores, click on the
 next to 'Bore Group' in the top right hand corner. This will show the WMIS bores.
 - To remove the bores from the 3D scene, untick the box next to WMIS Bores. To remove the other layers so you can only see the bores, click on the for 'Surface' and untick the aquifer layers.
- To modify the appearance in other ways, click on WMIS Bores to show the options for viewing.
- Figure 10 shows the default settings when the scene is loaded.
- Site marker - can be unticked to remove the pentagonal cones.
- Labels - can be ticked to show the Bore ID.
- Pipe lines - can be unticked to remove the cylindrical pipe below the surface that indicates the bore depth (where information is available)
- Depth logs - shows pentagonal cylinders underneath the site markers (for bores where logs are avaible), alternating between tan and brown showing a change in lithology.
- Depth log details - shows either the driller (D) or geologist (G) log depending on what is chosen under the drop down box (where they are available) as shown in Figure 11. You may need to untick the aquifer layers to see the log more clearly.
- Depth log type - A drop down box for either a driller (D) or geologist (G) log. Not all bores have this information. Some have both.
- Bore radius - a sliding scale to change the size of the bore shown on the map (for easier viewing). Range is from 1 to 1000 m.
.png)
Figure 11
Return to contents
Change appearance of the Ground surface and aquifer layers
- The surface and aquifer layers are found by clicking the next to the 'Surface' folder in the top left hand corner of the 3D scene page (Figure 12).
- To remove a layer from view, click the ticked box
 next to the desired layer and it will untick next to the desired layer and it will untick  . . - To change other settings with the layers, click on the name of the layer you wish to change and a set of options will come up below (Figure 13).
| 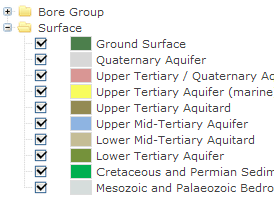
Figure 12 |
- Clipped - untick this box to show the whole layer even when a slice is cut.
- Slice visibility - this will show the layer edge at the sliced location even when the layer is hidden.
- Overlay - This is a drop down box that shows either 'Solid colour' or 'Elevation map' for the aquifer layers and also includes 'Aerial (Landsat7)', 'Aerial Photo' and '50k geology' for the Ground surface.
- Overlay legend - This displays a legend for the selected overlay if there is one (Elevation map?).
- Contour visibility - Tick this box to show contour lines for the layer (Figure 14).
| 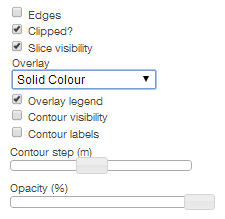
Figure 13 |
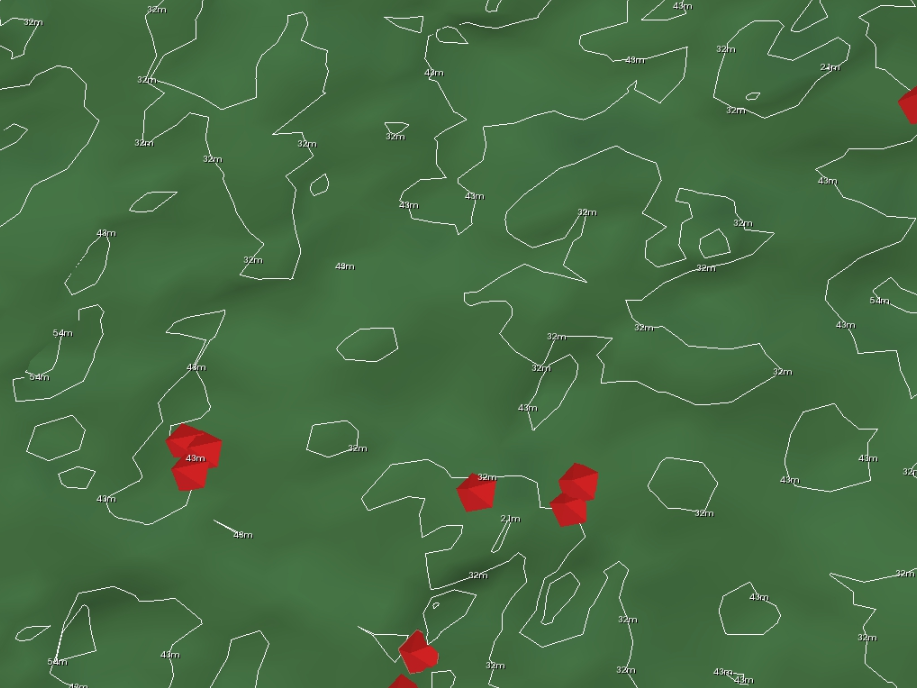
Figure 14
- Contour labels - Tick this box to show the height of the contours in metres. The 'Contour visibility' box must also be ticked for this to be visible.
- Contour step (m) - This is a sliding scale to change the increments in which the contour lines will be shown, varying from 1 - 100m. Again, the 'Contour visibility' box must be ticked to view the steps.
- Opacity (%) - This changes the ability to 'see through' the layers. The default is 100% which is a solid layer, you can go down to 0%, where the layer would not be visible anymore. Example shown in Figure 15, with the surface shown at 42% opacity. You can see the pipelines for the bores.
| 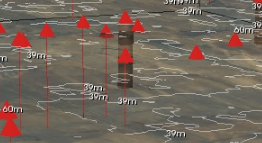
Figure 15
|
Return to contents
Show ground surface overlays
Aerial photo overlay
- Click on next to the 'Surface' folder in the top left hand corner of the 3D scene view.
- This will drop down the aquifer and surface layers.
- Click on the 'Ground surface' layer to bring up the options below.
- Click on the 'Overlay' drop down box and select 'Aerial photo'.
- If the aerial photo looks patchy, it is due to the aquifer layers shown higher. Hide these, or decrease their opacity.
| 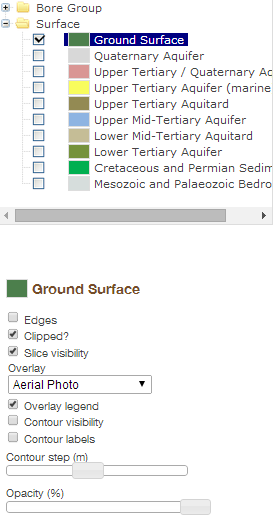
Figure 16 |
Return to contents
Geology overlay
- Click on next to the 'Surface' folder in the top left hand corner of the 3D scene view.
- This will show the aquifer and surface layers.
- Click on the 'Ground surface' layer to bring up the options (Figure 18).
- Click on the 'Overlay' drop down box and select 'Victoria Geology 50K/'. This will drape the geology over the surface as seen in Figure 19.
- If the geology looks patchy, it is due to the aquifer layers shown higher. Untick these, or increase their opacity.
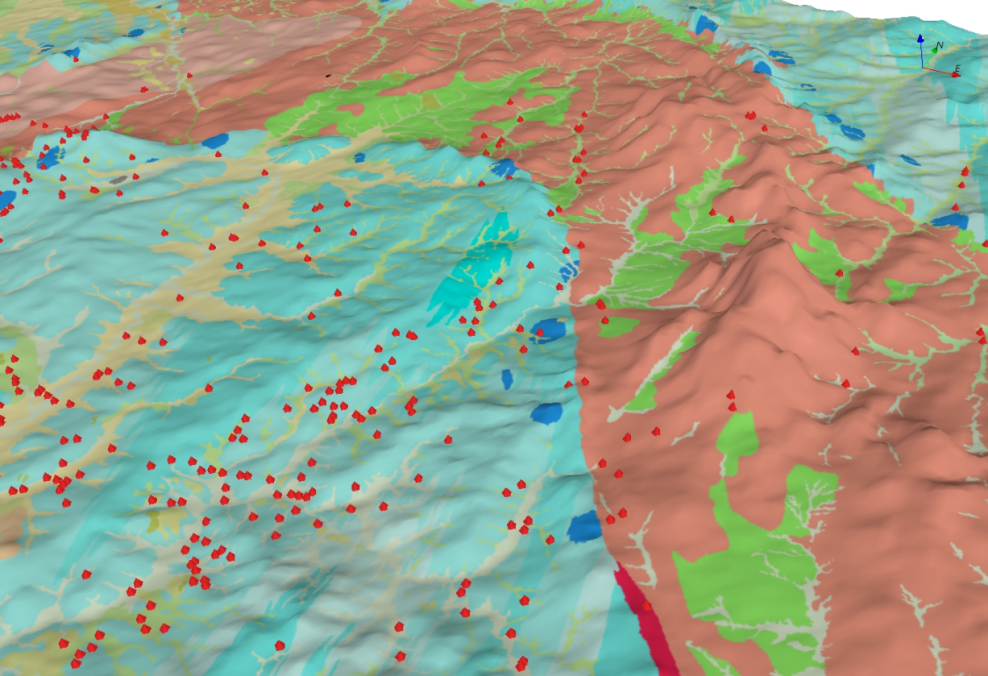
Figure 17
| 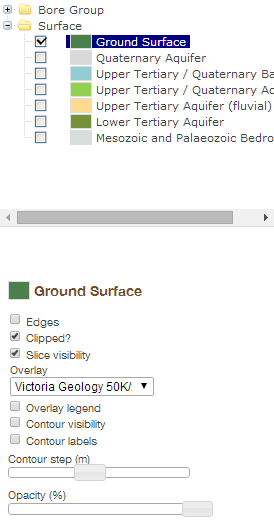
Figure 18
|
Return to contents
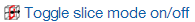 which covers the icon with a green square
  when on. A red rectangle will also appear in the 3D scene (Figure 5).
 straight away so you can make full use of the toggle slice (you can re-cut the slice multiple times). Alternatively rotate the 3D scene to a side view to see the red pointer with cones at each end as shown in Figure 6.
 .
.
.png)