Contents
Print bore data
WMIS and FedUni Spatial bore data printing
- Query the bore you would like to print.
- Click on the button on the right side of the query window.
- This will remove the tabs so you can print all of the pages within the tabs.
- Sometimes flash will not print within the browser. There is a workaround if you would like to print the monitoring and chemistry charts:
- Click cancel when the printing information comes up (after clicking 'Printable Version').
- Scroll down to the charts/flash and right-click each one and click on 'View as JPG' (Figure 1). Then right-click a place in the window and click on the print button.
- This changes the format from flash to JPG, so you can print it with the other information.
- Alternatively you can click on 'Print Chart' when you right-click the chart. This will only print the chart you have chosen.
- You can also print a tab at a time, say if you only want to print 'Monitoring' information.
- Left-click on tab you would like to print. Then right-click and select print from the options.
| 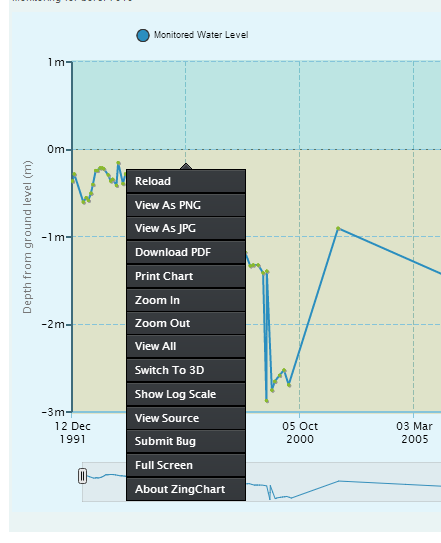
Figure 1 |
Note: Some data from the 'Monitoring' tab is spread over multiple pages (Figure 2) and cannot be printed out all at once at this stage. This method would require you to go to each page individually and print each. Alternatively you can zoom right in to your bore and download the SWL data as a CSV file for Excel in the same format with instructions here.
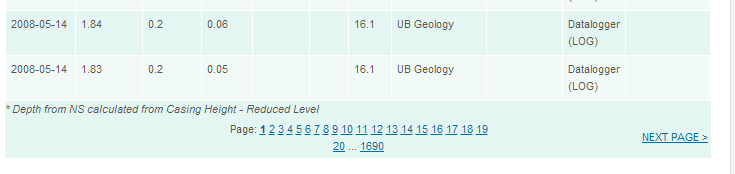
Figure 2
GEDIS individual bore data printing
- Search and query the bore you would like information on.
- The information that comes up in the query links to the GSV BIRT Report Viewer.
- Click on the print icon (Figure 3) located in the top left of the BIRT Viewer page.
- You have the option of printing in HTML or PDF.
- Choose HTML to print as viewed as you see the webpage
- Choose PDF to print the report only.
| .png)
Figure 3 |
Tip: If you would like to export the report as a PDF, Word doc etc. learn here.
Return to contents
Export data
Bore data in current map view to Excel
- Zoom in to the area you would like to export bore data from.
- Left-click mouse on the
 button located in the top right tabs above the map. This will direct you to the 'Map Tools' (Figure 4). button located in the top right tabs above the map. This will direct you to the 'Map Tools' (Figure 4). - Scroll down to Export heading.
- Click on one and it will take you to a page where you can download CSV files (Figure 5).
- SWLS (standing water levels) can contain many lines of data, so they are split up into four files based on bore number.
| 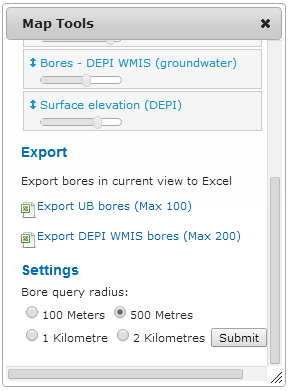
Figure 4 |
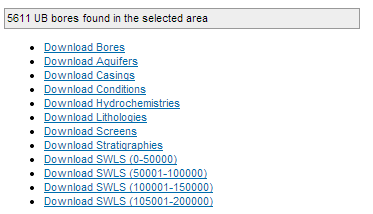
Figure 5
Map layer data (to desktop GIS)
Detailed information on how to do this with QGIS, ArcGIS and MapInfo coming soon. In the meantime look at this blog post How to access VVG web services for basic information on how to do this.
Return to contents
Download metadata from catalogue
This will be added soon. In the meantime go to How to access VVG web services or contact Kirsten McKenna at ke.mckenna@federation.edu.au.
Return to contents